This is the simplest way to understand why direct indexing exists.
If you hold one ETF, you have one harvest surface. If you hold dozens of underlying stocks, you have dozens of harvest surfaces. That is the whole advantage in one sentence.
The core difference
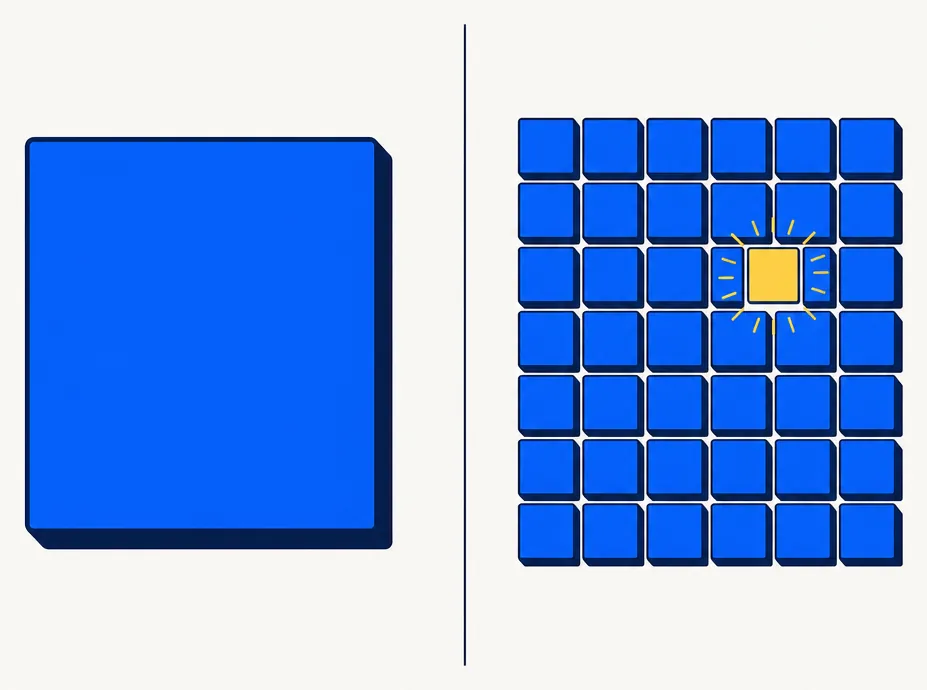
How does a single ETF's structure differ from a direct-index sleeve when it comes to tax-loss harvesting opportunity?
An ETF compresses underlying movement into one position — excellent for simplicity, but it collapses all the individual tax-lot opportunity into a single harvest surface that only activates when the fund itself declines.
A direct-index sleeve does the opposite. It keeps the broad market exposure, but preserves many individual positions underneath it. That means losses can show up in single names even when the overall index looks fine.
Why this matters in real portfolios
Why do individual stock losses within a direct-index sleeve create opportunity even when the market index is flat or rising?
Markets do not move as one perfect block. Even in an up year, some stocks are down. Even in a flat month, there are still losers under the surface. Direct indexing makes those individual losers usable as harvests.
That is the real economic edge. Not prediction. Not market timing. More usable tax-lot surface area.

The honest trade-off
What is the honest trade-off between holding an ETF and running a direct-index sleeve?
Nothing is free here: an ETF is cleaner, simpler, and lower-maintenance; a direct-index sleeve creates more tax opportunity but also more complexity and a real need for good portfolio software.
So the right comparison is not "which one has better marketing." It is "which one gives this account a better after-tax result net of the added complexity."
Where the math usually lands
For a meaningful taxable account, which approach typically produces a better after-tax outcome over time?
For a meaningful taxable account, direct indexing may produce a better after-tax outcome because the extra harvest opportunities can more than compensate for the added complexity.
That is especially true when all of these are present:
- high enough account size
- real taxable exposure
- multi-year time horizon
- wash-sale-aware replacement logic
Without those, the ETF can still be the right answer. With those, the ETF often starts looking like the blunt instrument.
The question investors should actually ask
What is the right framing for comparing a single ETF to a direct-index sleeve in a taxable account?
The better question is not "ETF or stock basket?" but rather: how much tax surface is being surrendered by collapsing this exposure into one holding?
Once framed that way, the product problem becomes obvious. A system that can manage the complexity without making the investor feel like they signed up for a second job earns its place.
Why this matters for HarvestEngine
Why does HarvestEngine focus on making the direct-index answer practically usable rather than just theoretically superior?
HarvestEngine exists because the direct-index answer is only better if the workflow is actually usable — tracking lots, finding harvests, picking replacements, avoiding wash sales, keeping the portfolio near target.
That means the product has to do more than just hold 60 names. It has to:
- track the lots cleanly
- find real harvest opportunities
- pick acceptable replacements
- avoid wash-sale mistakes
- keep the overall portfolio close to target
That is the difference between theory and a real operating system for taxable investing.
The investor takeaway
When does a plain ETF make sense, and when does a direct-index sleeve become the stronger choice?
If the account is small, low-tax, or short-horizon, the ETF is often the cleaner tool. If the account is meaningful, taxable, and long-horizon, direct indexing may deliver better results because the market creates far more harvest opportunities underneath the surface than a single ETF can expose.
That is not a niche nuance. It is the main event.
Read this next with TLH 101, direct indexing in 2026, tax alpha explained, and why ETFs are more tax-efficient than mutual funds.