
Open a margin account at any major broker, look at the balance page, and you'll see something disorienting: four different "cash" numbers. They can differ by 40× from each other. None of them is wrong. They're just answering different questions.
This article walks through what each of those numbers actually means, when they matter, and why HarvestEngine treats most of them as not relevant for long-only / ETF accounts — but surfaces them prominently the moment you designate an account for the short overlay.
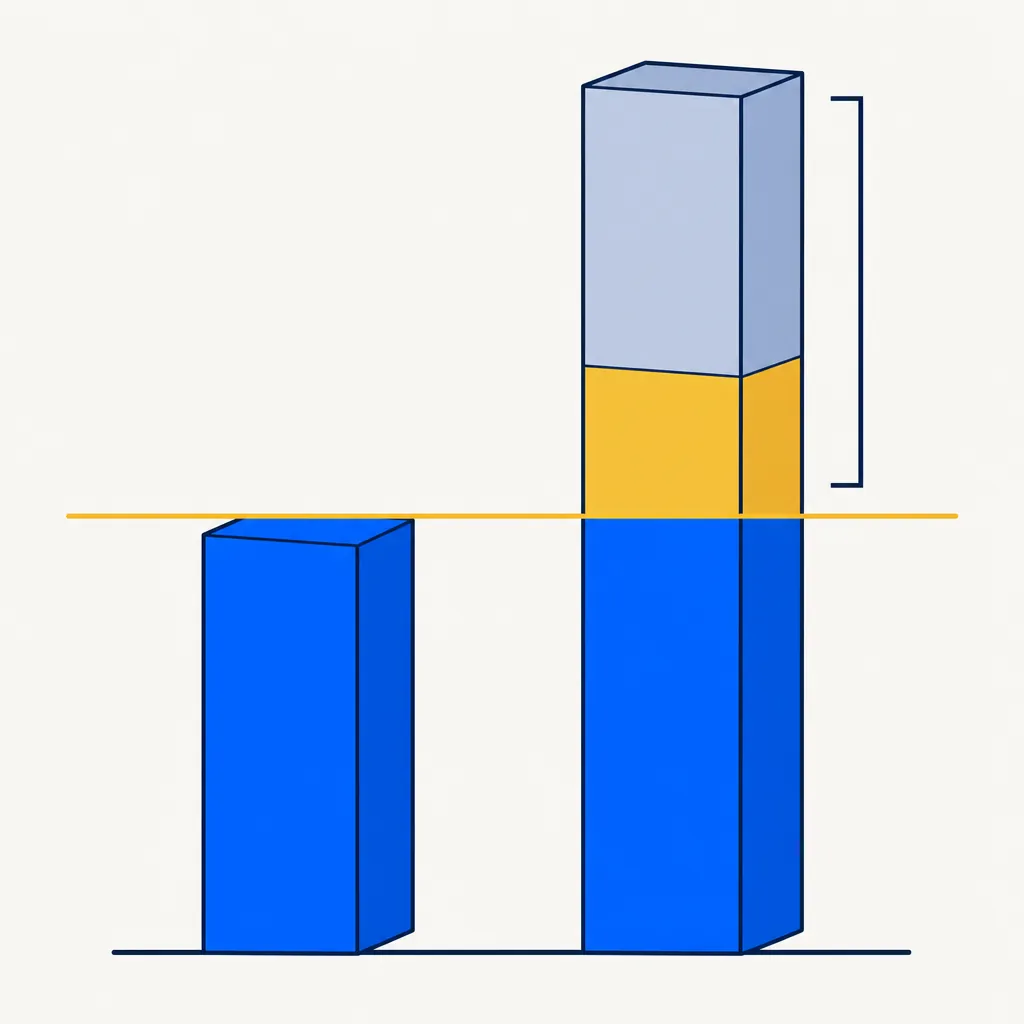
The four numbers, on one real example
What are the four different balance figures a broker shows on a margin account, and why can they differ so dramatically?
Brokers display four distinct figures — Investable Cash, Net cash/margin balance, Adjusted SMA, and Margin Buying Power — each measuring account capital through a different regulatory lens, which is why they can vary by approximately 40× on the same account at the same moment.
Here's the actual balance page on a real margin account with about $3.9M of equity:
| Field | Value |
|---|---|
| Investable Cash | $101,869.67 |
| Net cash/margin balance | $101,869.67 |
| Adjusted SMA | $2,011,038.43 |
| Margin Buying Power | $4,022,076.86 |
Same account, same moment. The smallest number is $101,869.67. The largest is $4,022,076.86. That's a 40× spread.
The investor's instinct is that one of these has to be wrong. They're all correct. They just measure different things.
1. Investable Cash — actual dollars you have
What does Investable Cash mean on a brokerage account?
Investable Cash is the literal settled cash in the account — the same number you would get from a checking account — and it is the only balance figure HarvestEngine surfaces in the Cash tile for long-only accounts.
This is the literal cash sitting in the account, settled, ready to deploy without taking on a margin loan.
It's the answer to "how much money do I have here?" — the same answer you'd get from a checking account.
This is the only number HarvestEngine surfaces in the dashboard's Cash tile. It's the operationally relevant number to treat as a real cash position. If you sold every position today and waited for everything to settle, this is roughly what you'd be left with in the account before any margin loans are repaid.
2. Net cash/margin balance — usually the same as Investable Cash
How does Net cash/margin balance differ from Investable Cash on a margin account?
On a cash-only account the two figures are identical; on a margin account they can differ briefly during settlement because unsettled trade proceeds appear in the net balance before they register as Investable Cash.
On a cash-only account, this is identical to Investable Cash.
On a margin account it can differ slightly during settlement: if you sold something this morning, the proceeds aren't quite "Investable Cash" yet (they're unsettled until T+1) but they show up here.
For practical purposes, treat this as a near-twin of Investable Cash.
3. Adjusted SMA — your "non-margin purchasing power"
What is Adjusted SMA on a brokerage account, and why does HarvestEngine show it only for short overlay accounts?
SMA (Special Memorandum Account) is a Regulation T accounting line tracking accumulated margin equity available for deployment without a fresh margin loan — HarvestEngine surfaces it as "Margin Available" exclusively on accounts designated for the short overlay, where it matters for sizing short positions.
SMA stands for Special Memorandum Account. It's a regulatory accounting line introduced under Regulation T that tracks how much margin equity you've accumulated over time that's available for non-margin investment.
Think of SMA as: "How much can I deploy in this account without taking on a fresh margin loan?"
SMA grows when:
- Your long positions appreciate (equity increases relative to margin debt)
- You deposit cash
- You sell a long position above its cost basis
SMA shrinks when:
- You buy stock without paying full cash for it
- You take a margin loan
- You short a stock (the short collateral comes out of SMA)
For the example above, $2,011,038.43 of SMA means: this account has accumulated about $2M of non-margin investing capacity. The investor could deploy up to $2M in new long positions (or short positions, or cash withdrawals) without needing to take a margin loan to do it.
This is the number HarvestEngine surfaces as "Margin Available" — and only on accounts you've explicitly designated for the short overlay sleeve. For long-only / ETF accounts, this number is irrelevant: you wouldn't take on margin to buy more VOO.
4. Margin Buying Power — the "leveraged" number
What is Margin Buying Power and what does it actually represent?
Margin Buying Power equals SMA divided by the 50% Regulation T initial margin requirement, representing the maximum amount an investor could deploy by borrowing against account equity — a leveraged figure that carries real interest and drawdown risk if used in full.
Margin Buying Power is your SMA divided by 50% (the Reg T initial margin requirement on long equities). For our example: $2,011,038.43 / 0.50 = $4,022,076.86.
What this number says is: "If you're willing to borrow against your account, you can spend up to this much on new long positions."
If you used the full $4M of buying power to buy long stock, you'd be putting in $2M of your own equity (the SMA) and borrowing $2M from the broker. The broker charges interest on the loan portion (the "margin rate," typically 6–13% depending on the broker and balance).
Most retail investors should never use their full margin buying power. The math compounds against you fast: a 25% drawdown on a 2× leveraged position is a 50% loss of your equity, and at some point the broker liquidates positions to protect the loan.
Maintenance excess and house requirements
What is maintenance excess on a margin account and what triggers a margin call?
Maintenance excess is the cushion between account equity and the broker's required minimum margin percentage — typically around 30% at E*TRADE — and when that cushion reaches zero the broker issues a margin call requiring a cash deposit or position liquidation within approximately three business days.
There's a fifth concept that's invisible most of the time but matters during a drawdown: maintenance excess.
Reg T requires you to maintain at least 25% equity on a margin position. Brokers typically apply stricter "house requirements" — at E*TRADE the standard is 30% on long positions and 30% on shorts. Some volatile names get bumped to 40%, 50%, or 100% (which effectively means they can't be shorted at that broker at all).
Maintenance excess = your equity − the 30% (or higher) requirement. When that number hits zero, you get a margin call: deposit cash within ~3 days or the broker liquidates positions to cover the gap.
For the example account: total equity $3,888,885.97, total maintenance requirement $1,137,047.59, maintenance excess $2,751,838.39. The market would need to drop materially before this account hits a margin call — but it can happen, and faster than people expect when individual positions move 30–50% in a single session.
Why HarvestEngine hides margin from long-only accounts
Why does HarvestEngine not display margin buying power figures for long-only account holders?
Long-only investors generally have no reason to use margin leverage, so displaying a large buying-power figure would create a misleading impression of available dry powder — HarvestEngine surfaces only Investable Cash for those accounts and shows margin metrics exclusively on accounts designated for the short overlay.
Reg T margin buying power is genuinely useful in two cases:
- Shorting. Shorts always require margin — you're borrowing the stock to sell, and the broker collateralizes the borrow against your account equity.
- Short-term leveraged trades. Some active traders briefly use buying power for opportunistic positions, then close them quickly.
For a long-only / ETF investor — the default HarvestEngine user — neither applies. You're holding broad-market exposure for the long term and harvesting tax losses around it. Showing you a $4M "buying power" number on a $5M portfolio doesn't help you make any decision; it just inflates the dashboard's Cash tile and creates the false impression that you have $4M of dry powder when you actually have $101K.
That's why the dashboard's Live Value headline = market value + literal cash. Margin doesn't roll in. The Cash tile reads "Investable Cash" only.
What changes when you flip an account to short overlay
What additional balance information and capabilities appear when an account is designated for short overlay in HarvestEngine?
Designating an account as Alpha Short overlay surfaces Margin Available (the SMA figure) in the dashboard header, enables the short overlay engine for single-stock shorts in that account, and activates house-requirement awareness when sizing short positions.
Designate an account as Alpha · Short overlay in Settings → Brokers and a few things happen at once:
- Margin Available appears in the dashboard header. That's the SMA — your non-margin purchasing power. Most relevant when you're sizing a new short position.
- The short overlay engine is allowed to short single-stock names in this account, generating realized losses without permanently changing your market exposure (because the short is paired with an equal long via index ETF rebuy).
- House requirement awareness kicks in when sizing shorts. The engine respects the 30% / 30% E*TRADE convention by default; volatile names get bumped per E*TRADE's published list.
The flag is per-account, not per-user. You might have a joint margin account designated for short overlay (because the cash is in the same place as the long sleeve and there's plenty of equity to collateralize against), and another individual account left long-only. They render with different headers in the same dashboard.
The investor-level takeaway
How should investors approach the different margin balance figures for practical decision-making?
For most long-only decisions, Investable Cash is the only relevant figure — it answers "how much settled money do I have" — while SMA matters mainly when sizing short positions, and Margin Buying Power is a leveraged maximum that comes with real borrowing costs and drawdown risk.
Margin is not the simple "extra free money" some product surfaces make it look like.
- Investable Cash is your real cash. That's the only number that should drive "do I have enough to buy this?" thinking.
- SMA / Adjusted SMA / Non-margin purchasing power is the equity available to deploy without taking a margin loan. Useful for shorts; rarely interesting for long ETFs.
- Margin Buying Power is the leveraged maximum. Useful in narrow cases. A bad default to anchor on.
- Maintenance excess is the buffer before a margin call. Worth checking during drawdowns.
HarvestEngine's dashboard reflects this by default: long-only accounts see Cash, never margin. Short-overlay accounts see Cash + Margin Available side by side, with the broader margin metrics one click away in the account detail.
The bottom line
What is the practical conclusion about margin account balance figures for long-only investors?
Margin is an accounting overlay on a single underlying balance viewed through different regulatory lenses, and for long-only investing the relevant view is almost always Investable Cash — the only figure that directly answers "how much settled money do I have right now?"
Margin is an accounting overlay on top of your account, not a separate pool of money. The four numbers your broker shows you are different views of the same underlying balance through different regulatory lenses. Once you internalize that, the spread between them stops being mysterious — and the right question becomes which view matters for the decision in front of you right now?
For long-only investing, the answer is almost always Investable Cash, full stop.
Read this next with short overlay: when extra flexibility is worth the complexity, using shorts as escape hatches, and the three sleeves.